The screen at a glance
Name every region of the Board screen: the HUD, the toolbar, the build dock, the Board, the Inspector, and the Inbox button, and what each HUD figure means.
The Board screen has five regions: the HUD at the top left, the toolbar at the top right, the build dock at the bottom, the Inspector on the right, and the Board itself behind all of them. A round Inbox button sits at the bottom right. Everything else is a panel that opens on top.
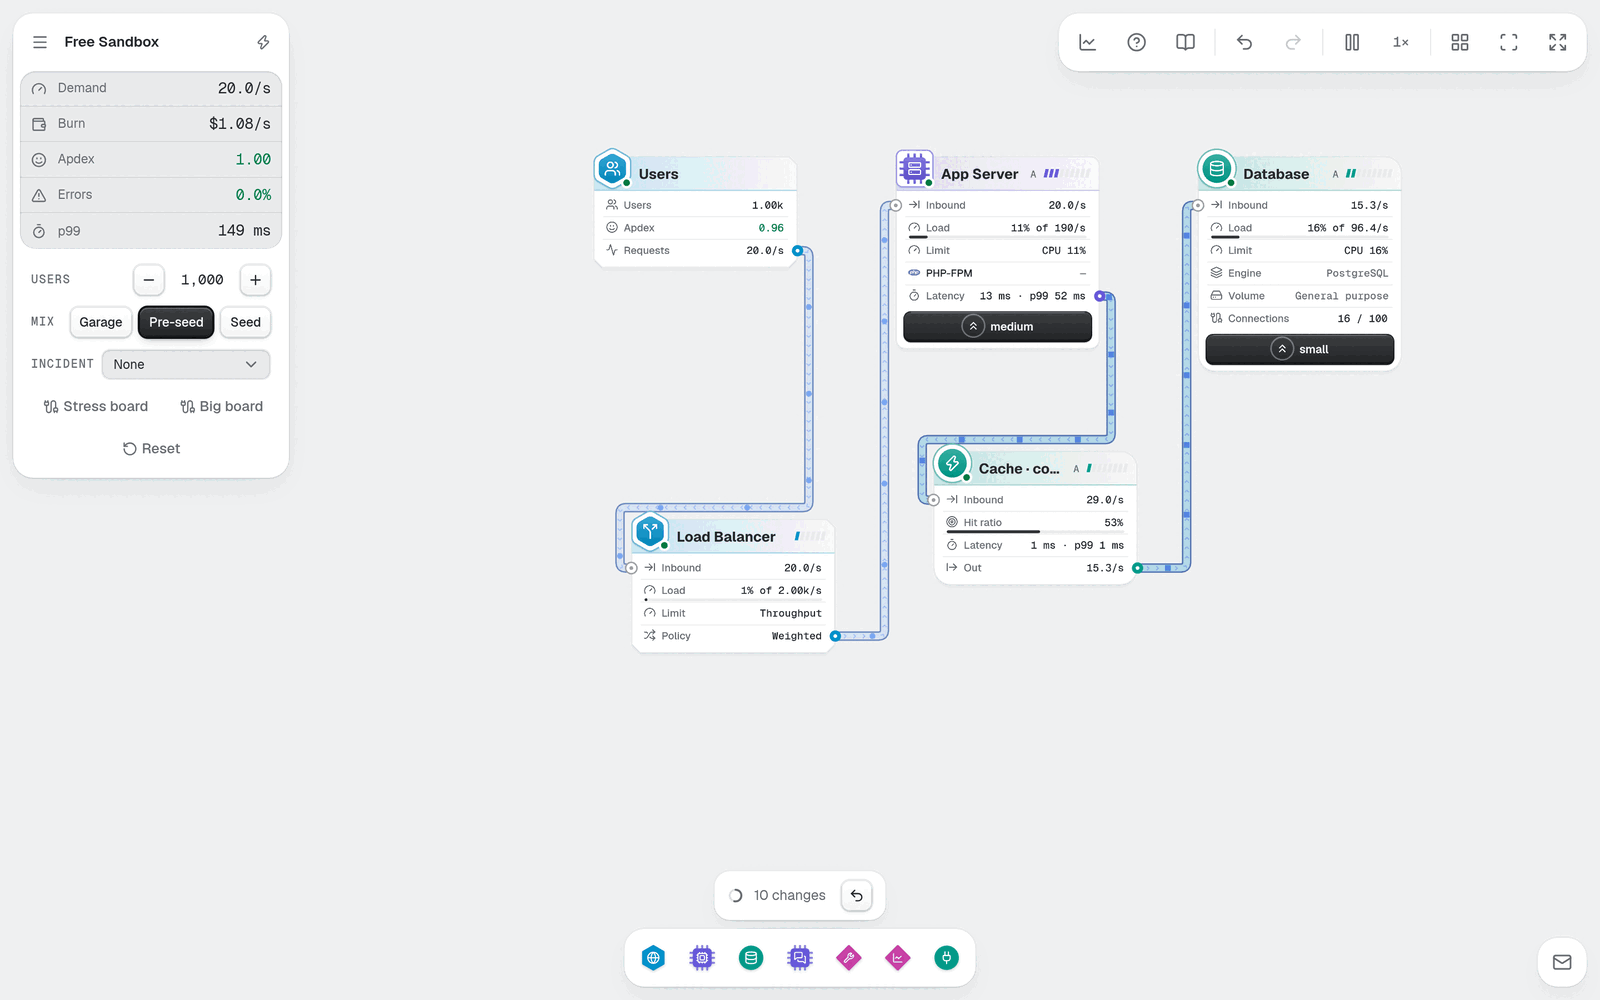
Find the HUD first, top left. Then follow the numbers: the HUD tells you how the Company is doing, and the Board shows why.
The game shows few controls at the start and adds the rest as you need them. A control missing from your screen has not been earned yet. It is not hidden by a setting.
The HUD#
The HUD is the card at the top left. It shows the figures that matter right now, one row each.
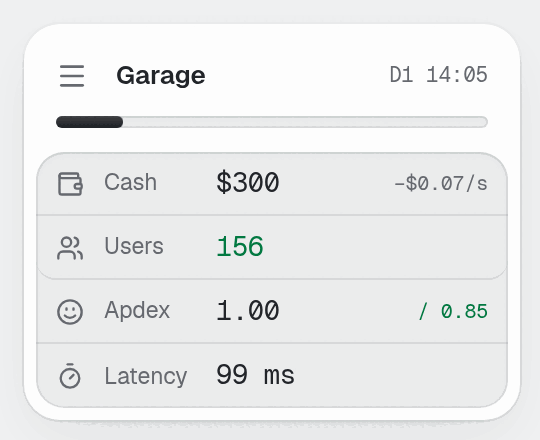
Look at the four rows under the Era name. Each has a name, a value, and a small note beside it.
The header row holds three things:
The Menu button, labeled Menu (Esc). It opens the game menu.
The Era name, such as Garage.
The calendar, such as
D1 14:01. One second of real time is one minute on the calendar.
A bar under the header fills as your users approach the next Funding round. When it is full, a button appears in its place that reads the next Era's name followed by offer. At the last step before going public it reads IPO.
The rows read as follows:
| Row | Value | Beside it | Click |
|---|---|---|---|
| Cash | The money you can spend | Net change per second, then runway in months | Opens the Dashboard, only when Cash is short |
| Users | The people using the Company | ▲ or ▼ with the recent change | Opens Why users leave |
| Apdex | Satisfaction, from 0 to 1, over the last hour | / and the Era's target | Nothing |
| Errors | The share of requests that fail | Nothing | Nothing |
| Latency | The mean time to answer a request | Nothing | Nothing |
Read them as a chain. Apdex at or above its target makes Users grow. More Users send more requests, which raises the load on your Nodes. When a Node runs out of Capacity, Apdex falls and Users leave. A ▼ next to Users with a red Apdex means a Bottleneck is hurting you now.
Some details of each row:
Cash turns red below zero. The note after the runway figure is
mofor a 30-day month. At zero Cash you can still sell and research, but you cannot place or upgrade anything.Users shows the change over the recent trend, not the total gained.
Apdex turns red below its target. Hover the row to read how the target works.
Errors appears the first time a request fails. Hover it for the causes, but only after you research Structured logs. Before that, the hover says Research Structured logs to see causes.
Latency becomes p99 once you research percentiles. The mean then shows beside it with a
μ. See Read p99.
Later rows appear when they apply: an SLO row, an SLA row, an Insight card with your running Study, and a Team card. They are covered in Research and Team panels.
The toolbar#
The toolbar is the strip at the top right. Hover a button to read its name and key.
| Button | Key | What it does |
|---|---|---|
| Research | R | Opens the research tree. A badge counts the Studies you can start. |
| Team | T | Opens the Team panel. An amber dot means the backlog is empty. |
| Playbooks | P | Opens saved Design parts. Appears after your first Exit. |
| Exit | None | Opens the Exit panel, from Series A. It shows the Legacy you would earn. |
| Dashboard | D | Opens the Charts. Needs the metrics research. |
| How to play | H | Opens the six core actions and the key table. |
| Glossary | G | Opens the engineering terms. Appears after your first Tradeoff card. |
| Undo and Redo | Z, Shift+Z | Appear after your first action on the Board. |
| Pause or Resume | Space | Stops and restarts the clock. |
| Speed | S | Shows the speed, such as 1×. Each press moves to the next one. |
| Tidy by zone | Shift+T | Arranges the Nodes by zone. |
| Fit the board | Shift+F | Zooms and pans so every Node is in view. |
| Fullscreen | F | Toggles fullscreen. |
At the start you see How to play, Pause, Speed, and the three board buttons. The rest appear as they become useful. On a phone, a More button holds the same actions. Clock, undo, and saves covers the speeds. Settings and key reference lists every key.
The build dock#
The build dock is the row of group icons at the bottom. It is how you place a Component.
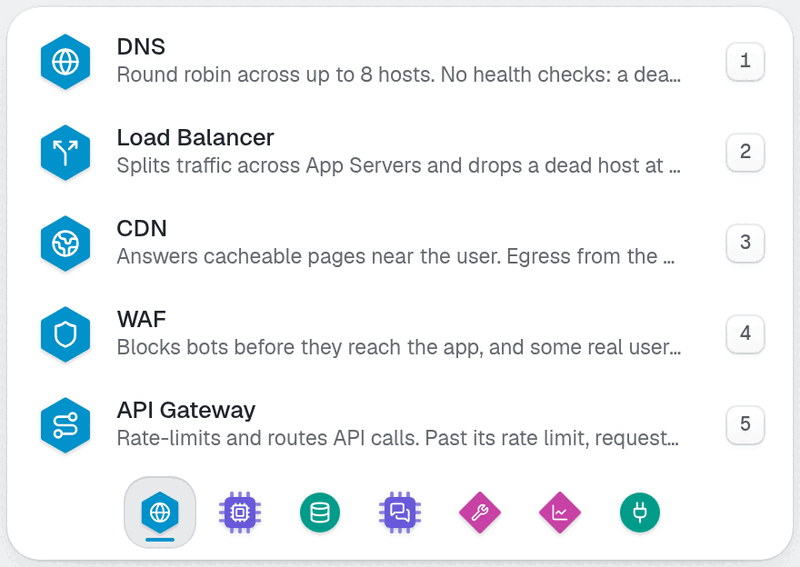
Look at the icons in the bottom row. Each is a group of Components. The list above them is what the open group holds.
There are seven possible groups: Edge, Compute, Data, Messaging, Platform, Observability, and Managed. A group shows only when it holds something you can place or will unlock next. A new Company shows four of them. Hover an icon to read its name and number, such as Edge (1).
Place Components walks through the dock step by step. While you hold a part, the dock shows its name, Click the board, and an X button. The same bar slot shows the selection bar when you select Nodes, and a sell bar when you ask to sell. Those are in Move, select, copy, sell.
The Board#
The Board is the surface behind everything. Your Nodes are cards on it, and Links join them.
Drag empty space to pan.
Use the mouse wheel to zoom, from a quarter size to one and a half. Pinch on a touch screen.
Click empty space to deselect.
Far out, a card loses its rows and then shrinks to a small chip. Use Fit the board to see the whole Design, and zoom in when you need to read a card. Read a Node card explains every row on one.
The Inspector#
The Inspector is the panel on the right. It opens when you select a Node, and it closes with the X button or Esc. It shows live figures, warnings in a red or amber box, and the options of that Node. The Inspector covers its sections.
The Inbox button#
The round button at the bottom right is the Inbox (I). A number badge counts unread Mail. The badge turns red, and the button pulses, when a message waits for your action. Mail, Dashboard, Glossary explains the folders.
The top lane and toasts#
Along the top of the Board, the game puts what needs a quick look: the region tabs once you run in more than one region, the pager and the incident banner when something breaks, and the change pill. The change pill names your last change, such as Resized App Server, and shows its effect on cost, latency, and errors, with an Undo button.
A short message, called a toast, appears when the game refuses an action or confirms one. Refusals use plain text, and each page of this section quotes the ones it can cause.
Mistakes to avoid#
Do not look for a button that is not there yet. Research, Team, and Undo appear when the game decides you need them.
Do not ignore the Errors row when it appears. A request failed, and the Node that caused it is the one to open.
Do not keep trying to place with a red Cash value. At zero or below, every placement is refused.
Next: Place Components.