The Inspector
The panel that opens when you select a Node. Its warnings, Resources gauges, Instance sizes, Calls (Link settings and policies), and Upgrade all.
Click a Node and the Inspector opens on the right. It is where you read why a Node is slow and where you change its size, its options and the policy of each Link it sends.
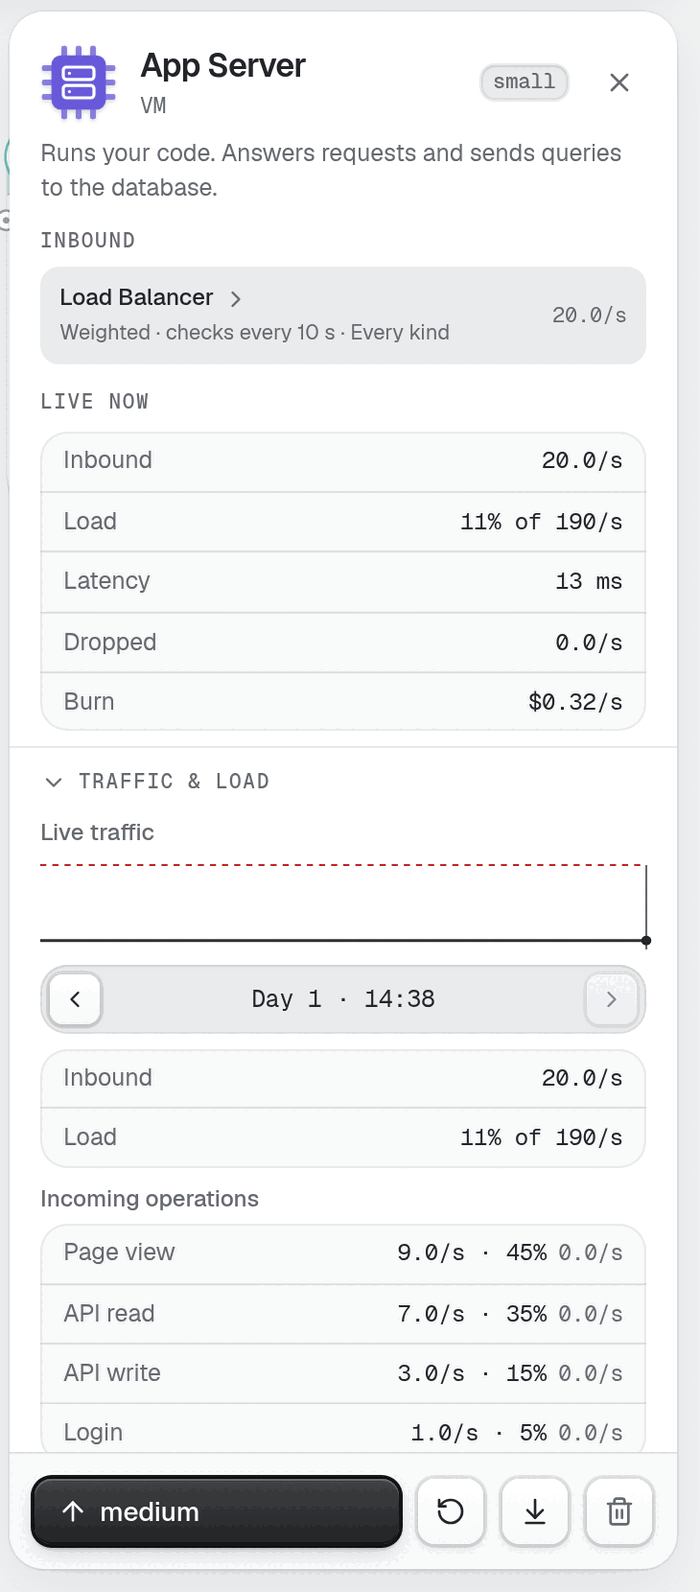
Look at the red box under the title and the Resources gauges below it. They answer why the card is full.
Close it with the Close button (the X) or Esc. Select another Node and it shows that one. Arrow keys select the nearest Node, and Enter on a selected Node moves focus into the panel.
Top to bottom#
Header. The Component's icon, its name and ordinal, the product it stands for, and a size badge.
Blurb. One line on what the Component does.
Warnings. A red or amber box for a problem right now. Examples: Out of RAM and swapping: every request is slower. (red), Out of CPU credits: throttled to 20% CPU. (amber), Refusing 12/s queries: too many connections. (red). A box can carry a button, such as Restart under a memory leak.
Live now. The Node's current figures, such as requests per second and latency. With Analytics linked, a traffic breakdown follows. With the
metricsResearch, Load, last day draws a trend line.Resources.
Instance.
Sections for the Component's own options. Which ones appear depends on the Component, such as the Stack of an App Server or the policy of a Load Balancer.
Calls.
Upgrade all, then the footer buttons.
Resources#
The first bar is the goal bar, named Limit · CPU or the resource that caps the Node now. Below it, one gauge per resource the Node has:
CPU: cores used out of cores owned.
RAM: GB used out of GB owned.
Workers busy: slots in use out of slots total.
Connections: open connections out of the maximum.
CPU credits: the balance of a Burstable box. This bar reads the room left, so a nearly empty bar is the trouble.
Network: traffic out of the network card.
When a limit has no gauge, the goal bar says so, for example Disk IOPS · no gauge. Nothing tight in green means no limit is close.
Read it like this: the warning box names the symptom, the goal bar names the limit, and the gauge shows how far along it is.
Instance#
Instance appears for sized Components, such as App Servers and Databases. It shows the size name with its vCPU and RAM.
Smaller (free) drops one size and costs nothing, but the Node restarts and the Cash you paid for the size does not come back.
Larger · $ buys one size. A click buys one. Hold it to buy more, one every quarter of a second. The key
Udoes the same for the selected Node.Buy ten sizes and Buy to the largest size buy several in a row, as far as your Cash goes. A toast says what happened and ends with Undo (Z) refunds $x for 30 s.
The family row picks Burstable, General, Compute, Memory or ARM. A family can show a Tradeoff card first. Read it and press Confirm.
Refusals are plain: App Server is at its largest size. and App Server is at its smallest size.
Calls#
Calls lists every Link that leaves this Node, one block per target. It appears after the Timeouts and retries Research. The Link itself has no settings panel, so you edit its policy from the Node that sends the call.
Each block starts with the target's name. The rows below are pickers. Pick one option in each row.
| Row | Options | How to read it |
|---|---|---|
| Timeout | 1 s, 5 s, 30 s | How long the caller waits. A short timeout frees the caller's slot sooner, but it fails calls that would have worked. 30 s is the default. |
| Retries | No retries, Retry 3×, Backoff | Retry 3× retries at once, up to three times, which multiplies load on a callee that is already failing. Backoff waits between retries and adds at most a tenth more calls. Backoff needs the Backoff with jitter Research. |
| Breaker | No breaker, Breaker | A Breaker stops the calls for 5 s when half of them fail. The label reads Breaker open while it is open. Needs Circuit breakers. |
| Bulkhead | No bulkhead, Bulkhead | A Bulkhead gives up on a call after 1 s and frees the slot. Needs Bulkheads. |
| Hedge | One copy, Hedge | Hedge sends a second copy of a slow call and keeps the faster answer. The tail drops, and the callee sees more calls. Needs Hedged requests. |
A row that its Research has not unlocked is missing, or its option is off. If you force an action that is locked, the toast names the Research, for example Backoff needs Backoff with jitter.
A Load Balancer adds a policy section of its own, with the request kinds each Link carries.
Pick Backoff plus Breaker on the Link into a Database to stop a retry storm. Stop a retry storm walks through the case.
Upgrade all#
Upgrade all N shows when the Board has two or more Nodes of the same Component in this region. One press grows every one of them by one size. N counts the Nodes that can still grow. A toast reads, for example, App Server ×3 grew one size. and adds Cash ran out. when Cash ended the run. The button is off when nothing can grow or you cannot pay.
The footer#
Collect on Payments, with the amount in the drawer.
The size button, which reads Bigger drawer on Payments, More samples on Analytics, and a size name elsewhere. Unlike the card footer, a click buys here.
Restart on App Servers and Workers. It frees leaked memory, and the Node comes back cold.
Drain after the Health checks Research. It stops new traffic and lets the Node finish what it holds.
Sell, whose tooltip reads Sell for $x (Delete). It opens the confirm bar. Fixed Nodes have no Sell.
Mistakes to avoid#
Hunting for settings by clicking a Link. Select the Node at the sending end and open Calls.
Buying Larger when the goal bar names Connections or Workers busy. More CPU does not fix a connection cap.
Choosing Retry 3× on a Link to a struggling Database.
Leaving a Burstable box when CPU credits reaches zero. Change the family, or the box stays throttled.
Next: Clock, undo, saves.