Mail, Dashboard, Glossary, pager, region tabs
Read the Inbox, the Dashboard, the Glossary and the pager, and switch between region tabs.
Press I for Mail, D for the Dashboard and G for the Glossary. The pager and the region tabs sit on the board itself, so you never open them.
The Inbox#
The Inbox is a button at the bottom right of the board. Its badge counts unread Mail, and the badge turns red when a message waits for your decision. Press I to open the panel and Esc to close it.
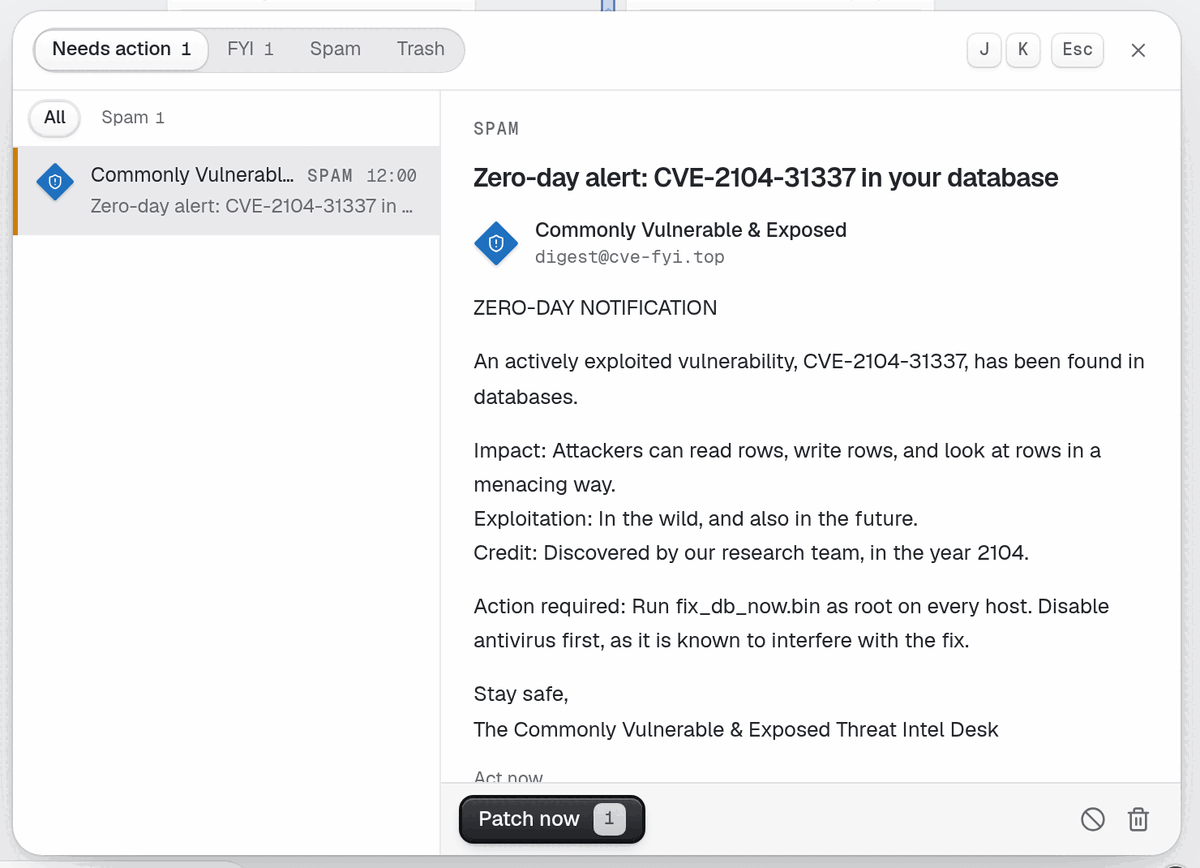
Look at the folders at the top: Needs action, FYI, Spam and Trash. Needs action holds Mail with a button that changes something and has no answer yet. FYI holds the rest.
Each row shows the sender's coloured badge, the sender, the time and the subject. The badge shape and glyph tell you the kind of sender: a cloud provider, a monitoring tool, a vendor, a teammate, an investor and so on. The colour comes from the company the sender parodies, so read the kind label too. Colour is never the only signal.
Mail about one thing from one sender is a Thread. A repeat joins the thread and shows a count instead of a new row. A thread resolves when its cause is gone, and it stays as a record.
To answer a message:
Select a row. The reader opens on the right.
Read the body, then the buttons under it. Show on Board selects the Node the message is about.
Click an action button, or press its number key.
1presses the first button,2the second, and so on.
| Key | Effect in the Inbox |
|---|---|
J | Next message |
K | Previous message |
E | Delete, or restore from Trash |
S | Report spam, or Not spam |
Esc | Close the Inbox |
Spam is mail no real sender would write. Opening it costs nothing, but acting on a trap does. When more than eight threads are unread, the oldest FYI threads fold into one Digest row. Nothing is lost, and the Digest lists each one.
Mistake to avoid: pressing a number key on a message you have not read. The key runs a real action, such as a resize or a raise.
The Dashboard#
The Dashboard opens with D, after you research metrics. It is a full-screen set of Charts that show the Design over time.
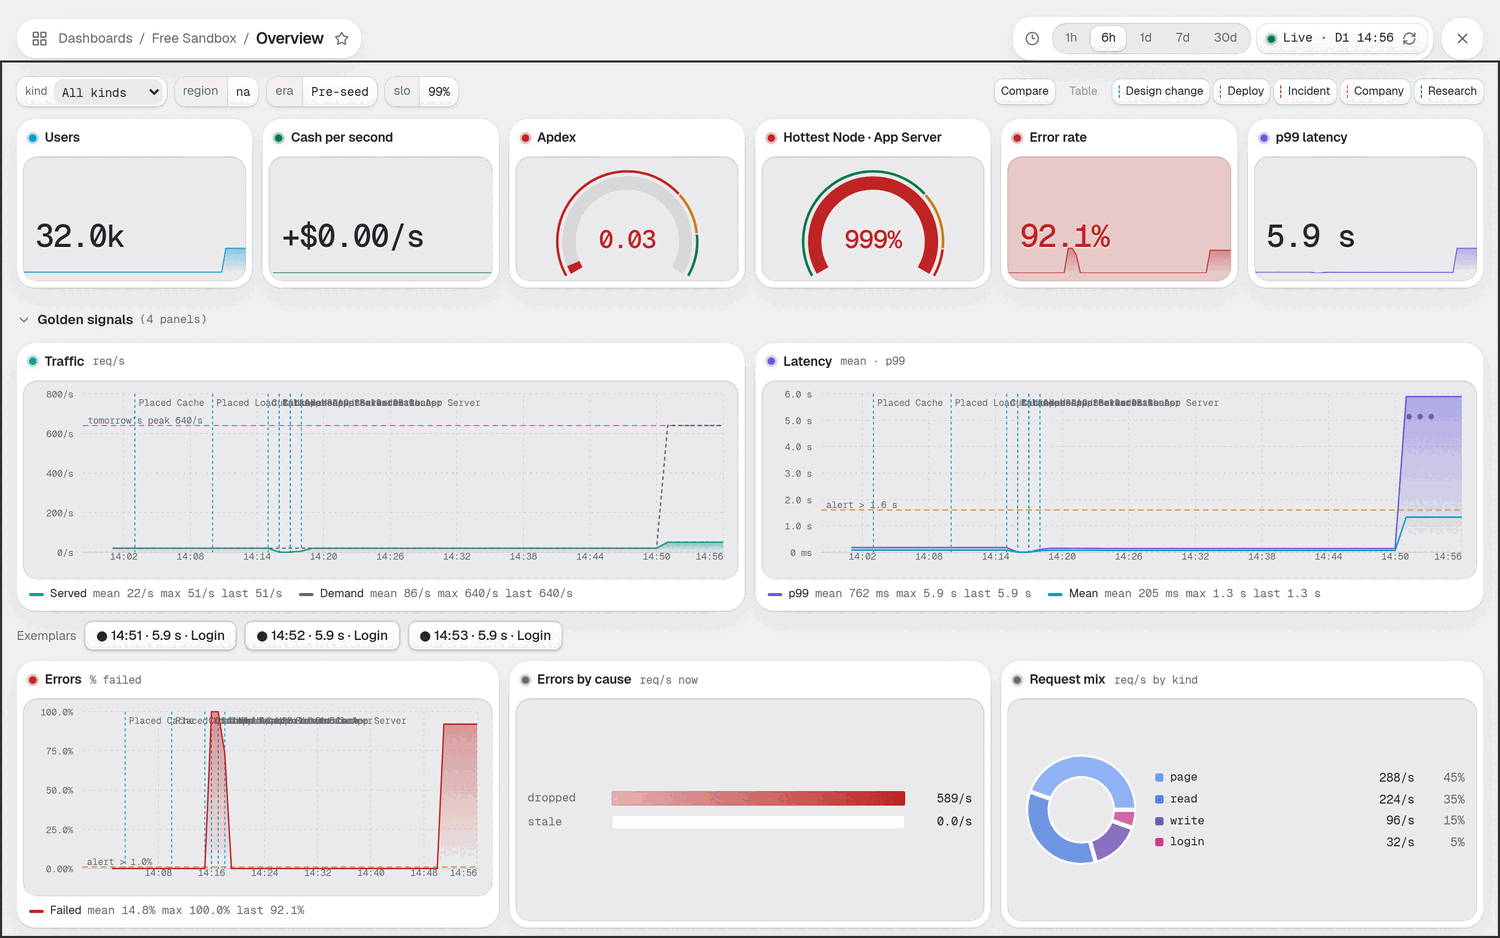
Read it from the top:
Time range. Pick 1h, 6h, 1d, 7d or 30d. These are calendar times, so one hour is about a minute of play at 1× speed.
Variables. The selects narrow every chart by request kind, and by Service and region when you have more than one.
Compare draws a faint line for yesterday on each time series.
Table turns each chart into a table of its values.
Annotation switches. Design change, Deploy, Incident, Company and Research each draw a coloured vertical marker on every time series. Turn one off when the markers crowd the line.
The first row holds the golden signals: Users, Cash per second, Apdex, the hottest Node, the error rate and p99. Below it you find a row for each Component, then Company and Incidents rows. To see why a line bent, turn on the switches and look for the marker just before the bend. Read Read p99 and tail latency for the latency charts.
More charts appear with each visibility Research, and a chart without its Research says which one it needs.
The Glossary#
The Glossary opens with G, after you meet your first Tradeoff card. It explains the engineering terms the game uses.
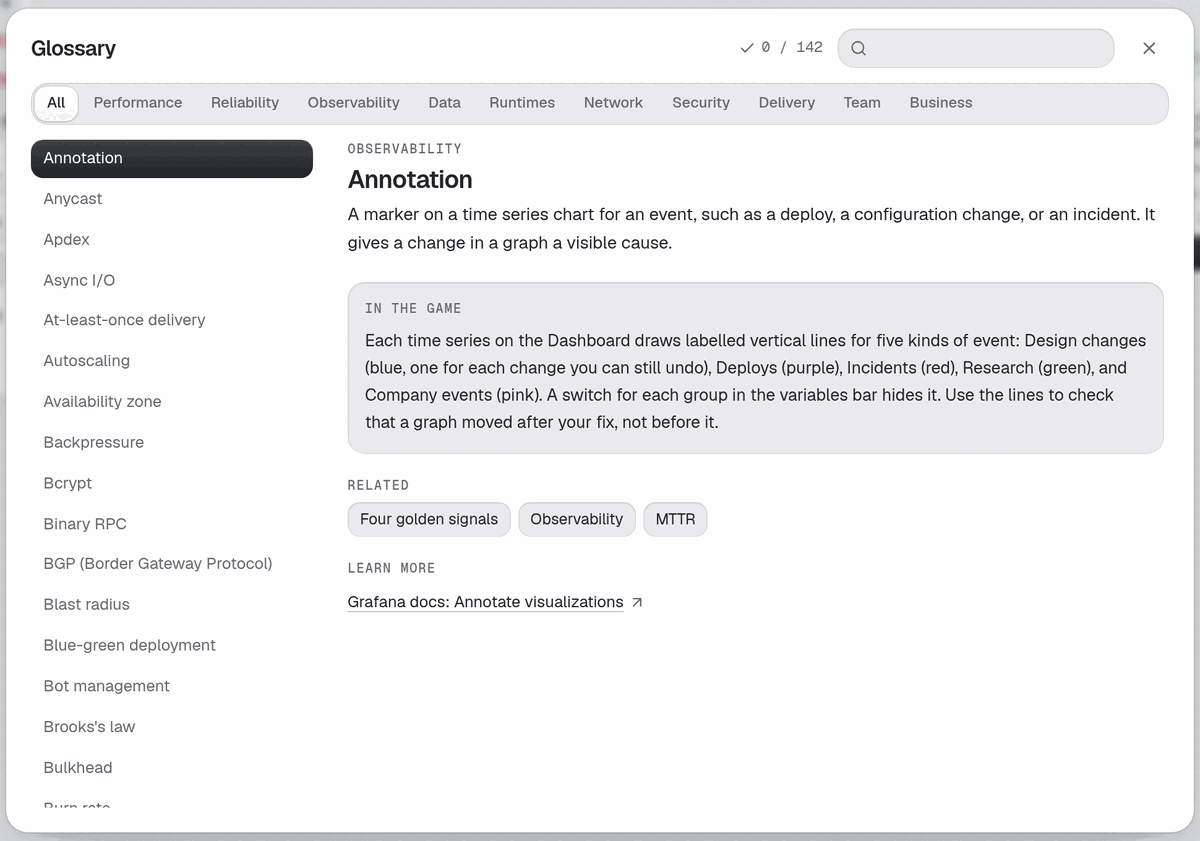
Type in Search the glossary to filter the list. Accents do not matter.
Pick a category chip, such as Performance, Reliability or Data. All clears the filter.
Click a term in the Terms list. Its entry opens with a short explanation, related terms and links to learn more.
The counter at the top, such as "5 / 80", shows how many terms you have met. A check mark marks each met term. Terms appear as the game shows them to you: a Tradeoff card, an advisory in Mail, or a link from an Inspector.
The whole Glossary is also on the wiki, under Glossary.
The pager and the incident bar#
Alerts need the alerting Research. After that, a red bar on the top lane of the board pages you when a rule holds long enough, for example "Error rate above 1%". It names a symptom, not a cause. A cascade adds a second chip that says "After" and the earlier incident that was left alone.
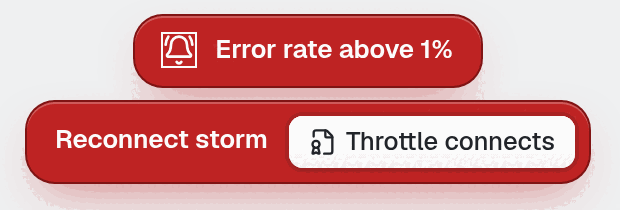
The pager bar sits above the incident banner. When the alert first fires, a toast with Acknowledge and Open also arrives in the corner, and the same alert lands in Mail.
The pager bar has no buttons. Fix the cause on the board and the bar clears. The buttons you can meet are:
Threshold buttons next to an Ignored badge. A rule that cried wolf too often goes quiet. Pick another threshold to switch it on again.
Roll back, on the Bad deploy banner. It is greyed until you research CI.
Renew, Fence leader, Cancel migration, Pin and redeploy, Restore, Restart, Restart Nodes, Fail over, Throttle connects and Move login. Each is the one-click fix for a matching incident, and the banner shows only the one that applies.
File, on a postmortem card at the bottom left after an incident. It saves the report. The action item button beside it researches the prevention. Use File with the small cross to leave the item open, which keeps that incident twice as likely.
Read Your first incident for a full walk-through.
Region tabs#
From Series C, with multi-region researched, a Regions bar shows on the top lane. Each open region is a tab with a short name such as NA or EU. Click one to see that region's Board. A closed region reads "+ EU". Click it to open the region, and hover first to read its price.
With infra-as-code researched, a Mirror button joins the bar. An amber dot on a tab means that region has drifted from its source. Read Go global.
Next: Settings and key reference.